Scheduling in a job shop is one of the most important functions for controlling constraints and ensuring on-time delivery to your customers. But like many other systems in a made-to-order shop, it has it's unique challenges. One of these challenges is what I like to call the two dimensional scheduling problem.
The easiest way to visualize this is with a playing card demonstration. Imagine we are sitting across from each other at a table, and I am holding this up in front of you:

I ask, "what am I hold up?" How do you respond? A Playing card? Ace of Spades? A rectangular piece of plastic-coated paper with a white background, black letter A's, and a strange shape? None of these would be right according to me. This is what I am seeing:

From my perspective, the card has a red pattern on it. If I change the position of the card further, and show you the card on its top edge, it becomes short, wide, and unreadable. If I hold the card sideways and show you the card on edge vertically, it is yet again different.

In each of these examples, the card remains the same; an ace of spades. But depending upon our perspective, it takes on entirely different properties and creates new challenges. Initially we fail to accurately describe the properties of the card because we attempt to use a 2 dimensional model to describe a 3 dimensional problem.
Scheduling
The production schedule in a job shop can be similar to the card demonstration shown above. Often we try to schedule work based solely on one attribute over time, such as earned hours or pieces. We are taking a two dimensional view of the problem, and may be missing key elements on our shop floor. Some production may make sense to track via pieces, some via hours, some using a measurement such as feet, or you may have to create a new metric entirely. To make matters worse, you often have a mix of product on your shop floor, meaning you have to track all the metrics simultaneously to get a true picture of what is occurring.
If you don't track them all simultaneously, constraints will be created that you may not see or understand until it is too late. A good example of this happened to me as a consultant:
The plant was running great. They had just completed a major Operational Excellence event, relieving the largest constraint, and pushing their efficiency well over 100%. Things were running as smoothly as anyone could ever remember.
Then in July of that year, they got a large order from a new customer that would dominate their backlog for months. The work was a little heavier than what they normally produced but they had certainly done much larger in the past. The number of pieces required was well within the limits of what they could produce. Extra care was taken when estimating these jobs to ensure they were accurate. They seemed to be set up for success.
As the work started, some strange things started to happen. Efficiency in the areas with this work remained high, yet the work did not seem to be moving out the door. They were earning the hours they were supposed to but not putting out the pieces expected, so WIP begin to pile up. Also, overall efficiency in the plant begin to drop.
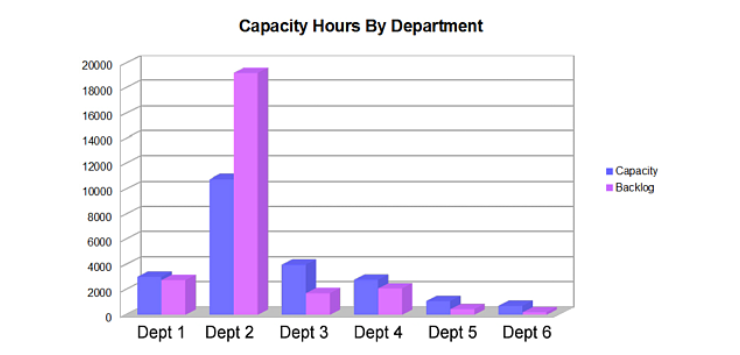
Rather than look at this plant solely based on pieces as they had always been done, I started looking at the schedule and backlog by hours. The total hours for the plant were fine. I drove down to a deeper level, and tracked the hours by department and work station, and found something startling:

As you can see in the chart above, they had over 19,000 hours each month scheduled in one department, but based on the amount of work stations and labor available, they could only produce 10,000 hours/month. No wonder they were falling behind! I drove down deeper to the process level, and found the following:

The extra work in this department was in operations 2 and 4. However, the identified constraints in this department were in operations 1 and 3. Somehow new constraints had been created by this new customer's work.
After careful examination of the work, the problem became apparent. Each process on each product took more labor than usual. This problem was magnified because this customer dominated the plant's backlog. Normally they would have a mix of a lot of diverse jobs from a number of customers, so a problem like this would be hidden in the chaos. It would still exist, but it would never see the light of day because it was hidden in all the variation of all the other jobs.
The overall plant efficiency drop was easy to explain as well. Most of the other departments in the plant were being starved for work. People were "staying busy" by slowing down to stretch what they had in front of them. In reality, a large number of people should have been transferred to the busy department, or work transferred them.
After this debacle, the plant started scheduling capacity by hours at the plant level, the department level, and at the process level. The plant also continued to track production by pieces as well, because there was certain production that made no sense to track by hours and created other constraints. It also led to a company wide SIOP event where a corporate scheduler was added to control the work put into each plant based upon these constraints.
Solution
As you can see from the previous example, you may need to analyze your production schedule in multiple ways to identify constraints. What I recommend you do is to create multiple control charts for your plant production each month, week, or day, depending upon how your backlog is set up. See my article on Product Mix Control Charts for more details.
For most people, you will want to have charts set up based on earned hours down to the process level, and you will want at least one other chart to analyze production by pieces, inches, machine process time, or whatever make sense in your operation. If you have an extremely complex operation, you may have more than two. I know of one fabrication shop that analyzes their crazy product mix with 5 different control charts just to make sense of what is going on in their schedule.
I can hear some of your groan now at the extra work, but better now than when your plant is all backed up. This is great justification to invest in software packages to automate the process, or even someone in your office that is good with excel macros can help limit the extra burden.


